What is a Moving Average?
I use moving averages to smooth noisy data and spot trends faster. In finance and analytics a moving average (MA) is a rolling average of a series typically closing prices over a defined window. It turns jagged price action into a clear trend line so you can focus on direction rather than daily noise.
SMA vs EMA — which one I pick
The Simple Moving Average (SMA) gives equal weight to each data point in the window; the Exponential Moving Average (EMA) weights recent prices more, so it reacts faster to new information. For short-term signals I prefer EMAs; for cleaner, longer-term support/resistance I lean on SMAs.
How the math actually works
SMA is straightforward: sum the last k values and divide by k. EMA uses a smoothing multiplier: Multiplier = 2 / (k + 1). You start EMA with the SMA of the first k periods, then apply the multiplier to give recent prices greater influence. If you like formulas, EMA = (Price_today × Multiplier) + (EMA_yesterday × (1 − Multiplier)).
Common setups and quick examples
Traders and analysts commonly use 8, 20, 50, 100, and 200-period MAs. Short windows (5–20) follow quick momentum; medium (50) tracks trend changes; long (100–200) shows structural direction. For instance, a 50-day crossing above a 200-day MA (a “golden cross”) often signals a durable uptrend. I watch these crossovers but always pair them with volume or momentum confirmation.
Practical uses I recommend
I use moving averages to:
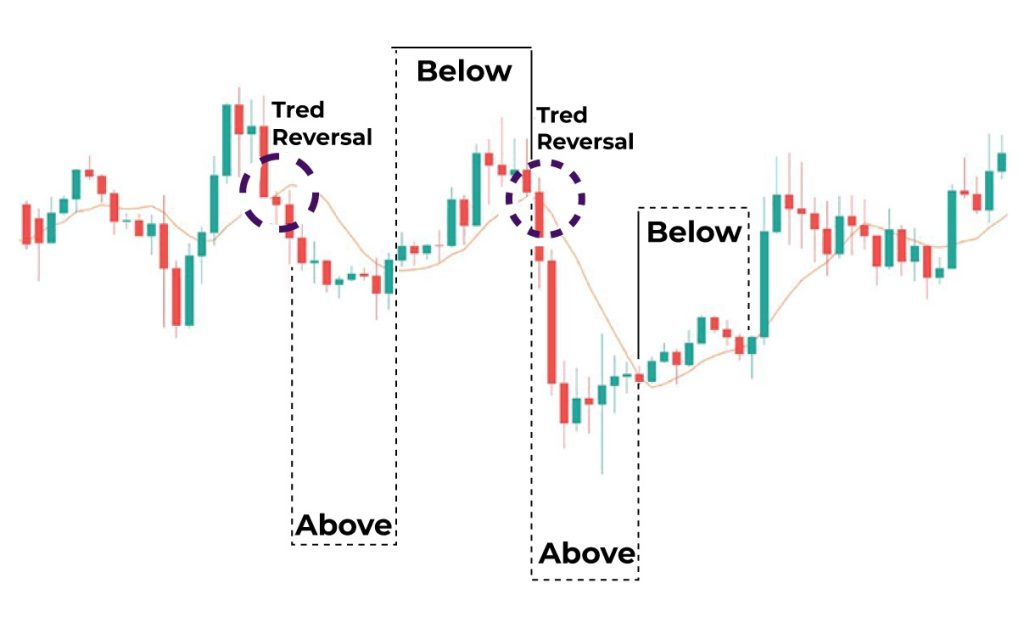
- Identify trend direction (price above MA = bullish bias).
- Define dynamic support/resistance (price often bounces off MAs).
- Create crossovers for entry/exit signals.
They’re also core building blocks for indicators like MACD, Bollinger Bands and many overlay tools. Remember: MAs lag they summarize history, not predict the future – so risk management matters.
Advanced tips I actually use
Don’t treat MAs as magical try weighted MAs or the Hull MA for less lag, use an EMA as a momentum filter and SMA for structural support. Backtest combinations on out-of-sample data to avoid curve-fitting.
How I test moving average rules
I run backtests, walk-forward tests and check for look-ahead bias. If you don’t code, most chart platforms offer basic strategy testers for quick and robust validation.
Simple example (numbers you can try)
Say daily closes are: 10, 11, 12, 13, 14. A 3-day SMA on day 5 = (12+13+14)/3 = 13. For EMA (k=3), Multiplier = 2/(3+1)=0.5. If initial SMA was 11 (first 3-day SMA), EMA_day4 = (13×0.5)+(11×0.5)=12; EMA_day5 = (14×0.5)+(12×0.5)=13.
Quick checklist before you trade
- Choose the right window for your time frame.
- Combine MA signals with volume and a momentum indicator.
- Avoid overfitting — don’t optimize parameters on past data only.
- Use stop-losses — MAs produce false signals in choppy markets.
Risk disclaimer
This is educational content, not financial advice. Always do your own research and test strategies on demo accounts before risking capital.
Call to action
If you want, I can build a simple spreadsheet or a 1-page cheat sheet that calculates SMA and EMA for your own data tell me your timeframe and I’ll set it up.